


New LEGO market analysis is now live on Brick-Tracker
Over the past few days, I’ve built a new tool in Brick-Tracker: the LEGO Market Analysis.
The idea behind it is simple: Instead of clicking through individual sets and Price Histories, you can analyze large portions of our database in just a few seconds and see right away which LEGO sets have seen particularly significant price movements after EOL, which are still below the MSRP, and which are already trading above it.
Try the LEGO Market Analysis Now
Compare 14, 30, 90, 180, or 365 days
What I find particularly exciting is that you can do more than just look back at old EOL data. You can also view the most recent trends and switch between 30, 90, 180, and 365 days.
This makes it very easy to see which sets have risen significantly just a few months after EOL, or where practically nothing has happened yet. It’s exactly this kind of backtracking that I find interesting: not just speculating about what might go up at some point, but first looking at what actually happened in the past.
Filter by EOL year, topic, price, and number of parts
Currently, you can filter the analysis by EOL year, LEGO theme, MSRP price range, and number of pieces, among other criteria. You can then sort the results by price trend.
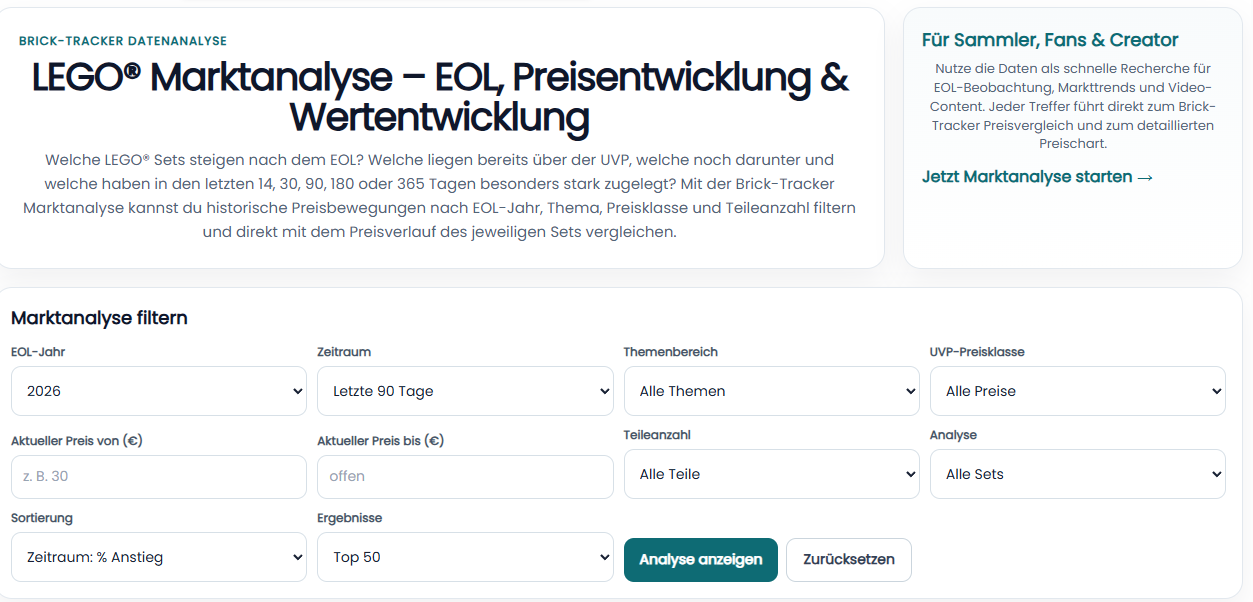
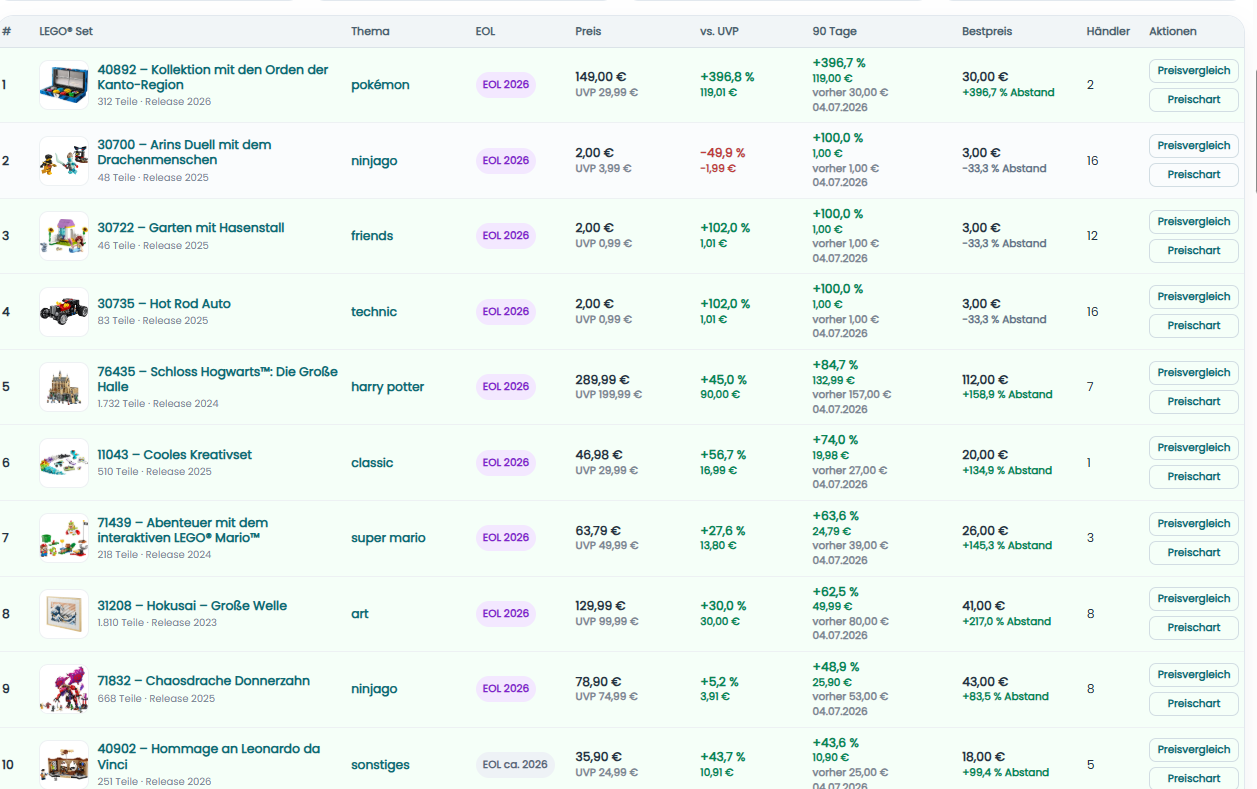
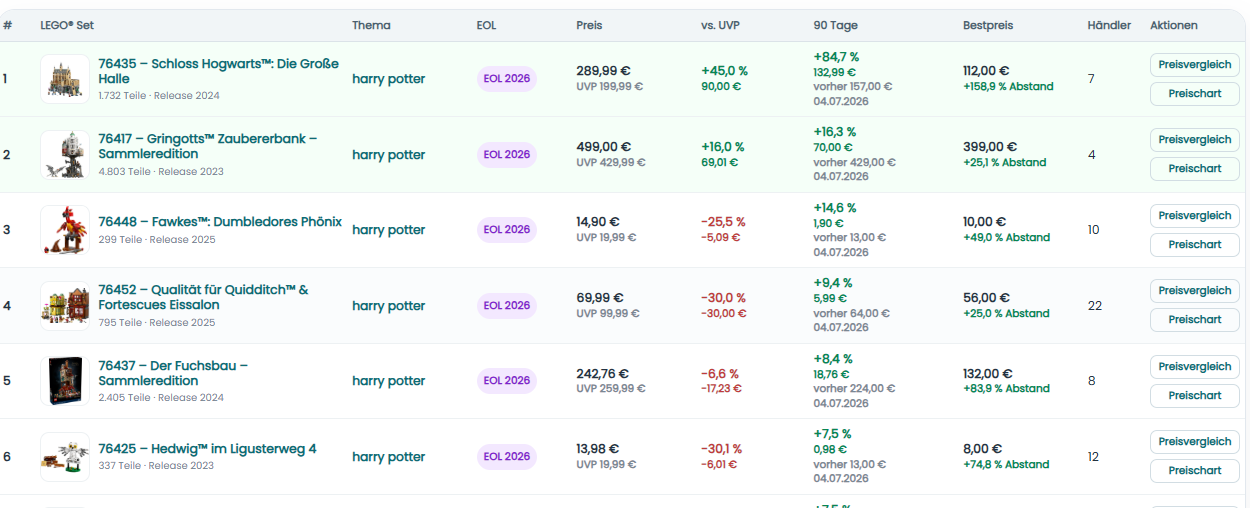
This allows you, for example, to quickly investigate questions such as:
- Which sets from a specific EOL year have seen the biggest increase in value recently?
- Which LEGO themes have historically performed particularly well or poorly?
- Which sets are now selling for more than their original MSRP?
- Which sets are still available at the MSRP despite being EOL?
- Where have there been particularly notable movements in the last 90 or 365 days?
Each result then takes you directly to the corresponding Brick-Tracker Price Comparison and the complete historical price chart. This way, you can immediately take a closer look at any notable price movements.
It’s also become helpful to me as a Seller
I no longer use market analysis just for Investment or EOL questions. It also helps me quickly identify which sets are currently in demand and for which models it might make sense to consider a sale.
Especially if you have a large Collection or multiple sets in storage, having an overview like this is much more convenient than having to look up each product individually.
That’s why this tool isn’t just for LEGO investors. Whether you’re a collector, a regular LEGO fan, or a content creator, it gives you a quick overview of the market.
In the video, I’ll walk you through the entire market analysis
I’ve also recorded a new YouTube video on this topic, where I walk through the features, filters, and a few specific examples.
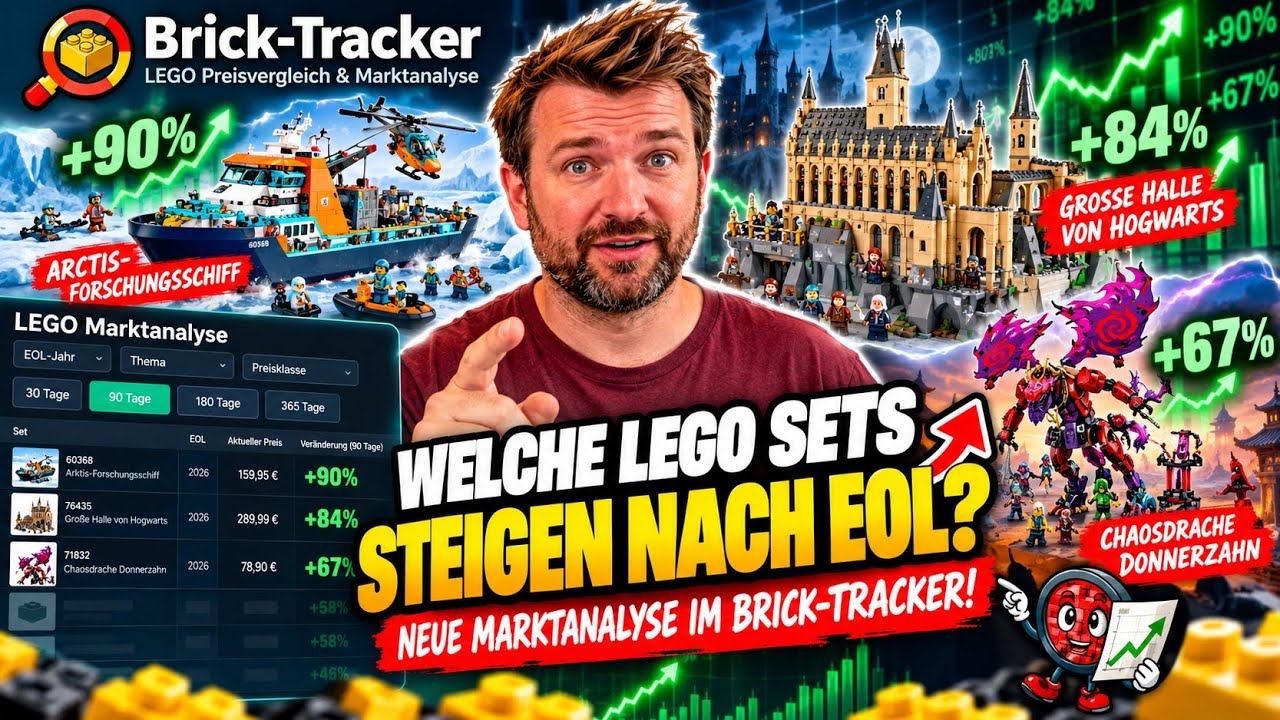
▶ Watch the video about the new LEGO market analysis on YouTube
You can now find the tool in several places on Brick-Tracker
The market analysis is now accessible not only via the direct link. I’ve also linked it on the home page, under “Top Deals,” and in the Price Comparison section so you can quickly jump to it while using Brick-Tracker as usual.
Are you still missing a filter?
The market analysis is still new and is being further developed. If you’d like to see a specific filter, an additional time frame, or another type of analysis, please feel free to contact me. With tools like this, the best enhancements often come from feedback from the community.
If you’d like to support the development of Brick-Tracker, you can also do so via Patreon:
Support Brick-Tracker on Patreon
- Brick-Tracker on Instagram
- Brick-Tracker on TikTok
- TCG Tracker
- All Trackers, Apps, and Community Channels
My Conclusion
For me, the market analysis has become a pretty useful tool after just a short time. It saves an enormous amount of time, especially when getting a quick overview of EOL model years, price trends, and product categories.
Of course, it’s important to remember that past price performance is no guarantee of future results. This tool isn’t meant to promise returns, but rather to make data visible and help you form your own assessment more quickly.
Feel free to give it a try—and if you need anything else, just let us know.